Data Science by Example
This tutorial will explore the Titanic data set to using data science techniques in order to determine what features in the data that are the strongest indicator of survivability. The full Python script is available at: https://github.com/markwkiehl/py_data_science_titanic
Some notes about the data:
- SibSp - # of siblings / spouses aboard
- Parch - # of parents / children aboard
- Embarked - where the traveler mounted from: Southampton, Cherbourg, and Queenstown
- Pclass - passenger class (1st, 2nd, 3rd)
- Cabin - a cabin identifier where the first character identifies the deck. From top to bottom: U, P, A, B..G, O, T (U = Boat Deck, A = Promenade, O = Orlop. T = Tank Top) |
This link provides a nice tabular visualization of the data in titanic.csv
We will use a correlation calculation to evaluate the statistical relationship between two values. Correlation measures the strength of the linear relationship between two variables. The data for the two variables to be analyzed for correlation should be normally distributed. The result of a correlation calculation is a correlation coefficient that varies as a floating point value between -1 and +1, where values closer to -1 or +1 are strongly (linearly) correlated. Read more about correlation and/or Python functions to calculate it.
Setup a Python virtual environment and install these modules:
py -m pip install --upgrade pip
py -m pip install memory-profiler
py -m pip install pandas
py -m pip install numpy
py -m pip install matplotlib
py -m pip install seaborn
py -m pip install scipy
py -m pip install psycopg2

py -m pip install SQLAlchemy
Configure a script to start with:
#Python performance timer
from pickle import NONE
import time
t_start_sec = time.perf_counter()


# pip install memory-profiler
# Use the package memory-profiler to measure memory consumption
# The peak memory is the difference between the starting value of the “Mem usage” column, and the highest value (also known as the “high watermark”).
# IMPORTANT:  See how / where @profile is inserted before a function later in the script.
from memory_profiler import profile


# import necessary libraries
import pandas as pd
import numpy as np
import matplotlib.pyplot as plt
import seaborn as sns
from scipy.stats import shapiro


@profile    # instantiating the decorator for the function/code to be monitored for memory usage by memory-profiler
def main():
    # Report the script execution time
    t_stop_sec = time.perf_counter()
    print('\nElapsed time {:6f} sec'.format(t_stop_sec-t_start_sec))


if __name__ == '__main__':
    main()		#only executes when NOT imported from another script
Hereafter everything will be added to the script in the function main() and a function it calls. Therfore I will only show the contents of main() and any functions it calls. Begin by reading into memory the Titanic dataset from kaggle and showing some basic information about it:
def data_collection():
    # load the Titanic dataset https://github.com/jorisvandenbossche/pandas-tutorial/blob/master/data/titanic.csv
    # into a pandas dataframe (df) from: https://github.com/jorisvandenbossche/pandas-tutorial/blob/master/data/titanic.csv
    #df = pd.read_csv("https://raw.githubusercontent.com/jorisvandenbossche/pandas-tutorial/master/data/titanic.csv")
    # OR
    df = pd.read_csv('data/titanic.csv')    # if you download the CSV file to a subfolder 'data' under the folder where this script resides.
    return df


def show_df_contents(df):
    # print general information about the DataFrame contents
    print(df.info())
    """
    <class 'pandas.core.frame.DataFrame'>
    RangeIndex: 891 entries, 0 to 890
    Data columns (total 12 columns):
     #   Column       Non-Null Count  Dtype
    ---  ------       --------------  -----
     0   PassengerId  891 non-null    int64
     1   Survived     891 non-null    int64
     2   Pclass       891 non-null    int64
     3   Name         891 non-null    object
     4   Sex          891 non-null    object
     5   Age          714 non-null    float64
     6   SibSp        891 non-null    int64
     7   Parch        891 non-null    int64
     8   Ticket       891 non-null    object
     9   Fare         891 non-null    float64
     10  Cabin        204 non-null    object
     11  Embarked     889 non-null    object
     """

    # print out statistics about the DataFrame
    print(df.describe())
    """
            PassengerId    Survived      Pclass         Age       SibSp       Parch        Fare
    count   891.000000  891.000000  891.000000  714.000000  891.000000  891.000000  891.000000
    mean    446.000000    0.383838    2.308642   29.699118    0.523008    0.381594   32.204208
    std     257.353842    0.486592    0.836071   14.526497    1.102743    0.806057   49.693429
    min       1.000000    0.000000    1.000000    0.420000    0.000000    0.000000    0.000000
    25%     223.500000    0.000000    2.000000   20.125000    0.000000    0.000000    7.910400
    50%     446.000000    0.000000    3.000000   28.000000    0.000000    0.000000   14.454200
    75%     668.500000    1.000000    3.000000   38.000000    1.000000    0.000000   31.000000
    max     891.000000    1.000000    3.000000   80.000000    8.000000    6.000000  512.329200
    """
    # 38% of the passengers in this data set survived.

    # print the first few rows of the DataFrame
    print(df.head())

    # print the DataFrame's shape
    print(df.shape)

    # print the DataFrame's data types
    print(df.dtypes)


@profile    # instantiating the decorator for the function/code to be monitored for memory usage by memory-profiler
def main():
    # Load the Titanic dataset
    df = data_collection()

    # Show some basic information about the CSV file contents in the DataFrame df
    show_df_contents(df)

    # Report the script execution time
    t_stop_sec = time.perf_counter()
    print('\nElapsed time {:6f} sec'.format(t_stop_sec-t_start_sec))
Note that from df.describe() we can see that 38% of the passengers in this data set survived. That gives us a chance of using the data to predict survivability.
Check the data for missing values.
def data_cleaning(df):
    # check for missing values
    print('DataFrames with missing values:')
    print(df.isnull().sum())


@profile    # instantiating the decorator for the function/code to be monitored for memory usage by memory-profiler
def main():
    # Load the Titanic dataset
    df = data_collection()

    # Show some basic information about the CSV file contents in the DataFrame df
    #show_df_contents(df)

    # Data Cleaning
    data_cleaning(df)

    # Report the script execution time
    t_stop_sec = time.perf_counter()
    print('\nElapsed time {:6f} sec'.format(t_stop_sec-t_start_sec))
Results for only those fields/columns with missing data:
Age            177
Cabin          687
Embarked         2
Thinking about the data that is available and what I know about the Titanic event, I recall from the movie that passengers in first class were evacuated first, and then women and children were evacuated from the ship before the men. That fact should influence survivability, so we will focus first on the data for 'Survived', 'Pclass', 'Age', and 'Sex'. The column 'Sex' has categorical values as 'male' and 'female'. We need numerical values for the 'Sex' column in order to perform calculations on it, so we will convert it within our data_cleaning() function..
def data_cleaning(df):
    # check for missing values
    print('DataFrames with missing values:')
    print(df.isnull().sum())
    # Results: missing values for Age, Cabin, Embarked

    # Convert column 'Sex' values 'male' and 'female' to 1 and 0
    df['Sex'].replace(['male', 'female'],[1, 0], inplace=True)
    columns = ['Survived','Pclass','Sex','Age','Fare']
    print(df[columns])  # print the first few and last rows in the DataFrame
SibSp is the number of siblings / spouses aboard, and Parch is the number of parents / children aboard. Combine SibSp and Parch into a new column 'relatives' as the total number of relatives a person has on the Titanic.
def data_cleaning(df):
    # SibSp is the number of siblings / spouses aboard, and Parch is the number of parents / children aboard.
    # Combine SibSp and Parch into a new column 'relatives' as the total number of relatives a person has on the Titanic.
    df['Relatives'] = df['SibSp'] + df['Parch']
    columns = ['PassengerId','Relatives','SibSp','Parch']
    print(df[columns].to_string())  # print all of the data for the columns specified by columns
The 'Cabin' data contains information about the deck level. Extract the deck level and replace it with a numerical value so it can be used for correlation analysis.
def e_d_a(df):
    # Exploratory Data Analysis (EDA)

    # Extract the deck level information from the 'Cabin' column' and
    # convert it to a numeric value.
    #
    # On the Titanic, there were 10 decks in total, from top to bottom passenger decks were A .. G.  In the data set, only A .. G exist.
    levels = []
    for level in df['Cabin']:
        if isinstance(level, float):
            levels.append(level)    # Retains NaN
        else:
            # Convert to a string and then get the first character
            s = str(level)
            levels.append(s[0])
    # Create a new column 'Deck'
    df['Deck'] = levels
    # Remove the one value incorrectly assigned as 'T' and set to NaN
    df.loc[ df['Deck'] == 'T', 'Deck'] = float('NaN')
    # Print out and compare the 'Cabin' and 'Deck' columns to verify the conversion was valid
    """
    columns = ['Cabin','Deck']
    print(df[columns].to_string())
    """
    #print(df['Deck'].value_counts())    #print a summary of the contents of column 'Deck'
    """
        C       59
        B       47
        D       33
        E       32
        A       15
        F       13
        G        4
    """
    # In column 'Deck', replace NaN with 0 and 'A' .. 'G' with 1 .. 7
    df['Deck'].replace([float("NaN"),'A','B','C','D','E','F','G'],[0,1,2,3,4,5,6,7], inplace=True)
    # Convert column 'Deck' to type integer
    df['Deck'] = df['Deck'].astype('int')
    # Print out and compare the 'Cabin' and 'Deck' columns to verify the conversion was valid
    """
    columns = ['Cabin','Deck']
    print(df[columns].to_string())
    """
    """
        Results:
            0    688
            3     59
            2     47
            4     33
            5     32
            1     15
            6     13
            7      4
    """
    #print(df['Deck'].value_counts())    #print a summary of the contents of column 'Deck'
Using the new 'Deck' column, determine if a relationship exists between the probability of survival and the deck level.
    # Exploratory Data Analysis (EDA)

    # Using the new 'Deck' column, determine if a relationship exists between the probability of survival and the deck level
    sns.lineplot(x='Deck', y='Survived', data=df, err_style="bars")
    plt.show()
The chance of survival was better if you were a passenger on decks B through E. Image of Titanic deck levels
Values are missing for the 'Age' data, so lets make sure what data is left is at least normally distributed by visualizing the data and performing a Shapiro-Wilk test. Update the e_d_a() function as follows:
def e_d_a(df):
    # Exploratory Data Analysis (EDA)

    # Plot the distribution of 'Age' to make sure the values are normally distributed (since values are missing)
    sns.distplot(df['Age'])
    plt.show()

    # Statistically evaluate if the data in 'Age' is normally distributed using the Shapiro-Wilk test
    stat, p = shapiro(df['Age'])    # Requires: from scipy.stats import shapiro
    print('Statistics=%.3f, p=%.3f' % (stat, p))
    # interpret
    if p > 0.05:
        print('Column Age looks Gaussian (fail to reject H0)\n')
    else:
        print('Column Age does not look Gaussian (reject H0)\n')
    # Results: Column Age looks Gaussian (fail to reject H0)
The Pandas .corr() function supports three methods for the correlation calculation: Pearson (linear), Spearman (non-linear), and Kendall, and the default method is 'Pearson'. NOTE: correlation does not imply causation!
def e_d_a(df):
    # Exploratory Data Analysis (EDA)

    # Use data.corr() to calculate a correlation matrix for the dataset where the columns contain numeric data
    columns = ['Survived','Pclass','Age','Sex']
    corr_mat = df[columns].corr()
    print(corr_mat)
    """
    Results:
              Survived    Pclass       Age       Sex
    Survived  1.000000 -0.338481 -0.077221 -0.543351
    Pclass   -0.338481  1.000000 -0.369226  0.131900
    Age      -0.077221 -0.369226  1.000000  0.093254
    Sex      -0.543351  0.131900  0.093254  1.000000
    """
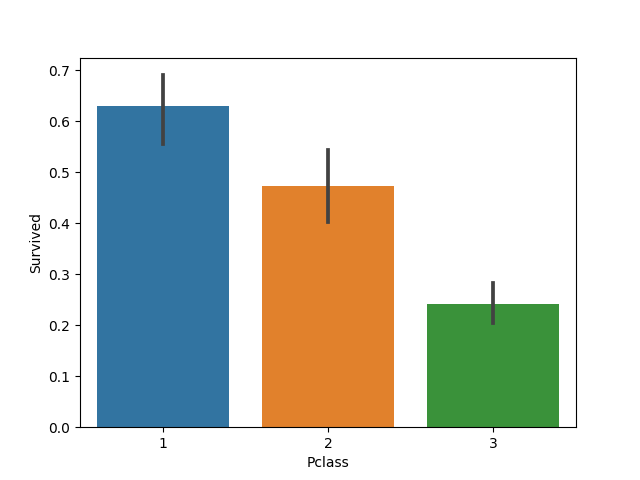
No strong correlation indicated from this initial assessment. Lets add a visualization of 'Survived' and 'Pclass' to our function e_d_a().
def e_d_a(df):
    # Exploratory Data Analysis (EDA)

    # Visualize the relationship between passenger class (Pclass) and who survived
    sns.barplot(x='Pclass', y='Survived', data=df)
    plt.show()
    # Results:  Passenger class (Pclass) definitely contributed to a person's chance of survival.
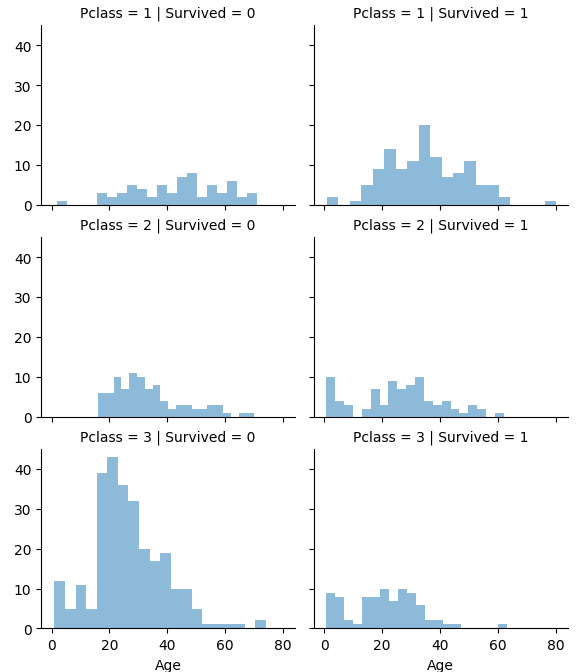
Passenger class (Pclass) definitely contributed to a person's chance of survival. Lets look at how age fits into that relationship.
def e_d_a(df):
    # Exploratory Data Analysis (EDA)

    # Visualize the relationship of 'Age' and 'Pclass' to 'Survived'
    grid = sns.FacetGrid(df, col='Survived', row='Pclass')
    grid.map(plt.hist, 'Age', alpha=.5, bins=20)
    grid.add_legend();
    plt.show()
The charts show that passengers of all ages in Class 1 have a better chance of survival, and class 3 passengers are unlikely to survive. Survival is a flip of the coin for class 2 passengers of any age.
Now look at the 'Relatives' data to see if having any relatives aboard influenced their survival probability.
def e_d_a(df):
    # Exploratory Data Analysis (EDA)

    # Determine if a passenger having relatives aboard affects their survival.
    print(df['Relatives'].value_counts())   # Pandas value_counts() function returns object containing counts of unique values.
    """
	Results:
		0     537
		1     161
		2     102
		3      29
		5      22
		4      15
		6      12
		10      7
		7       6
    """
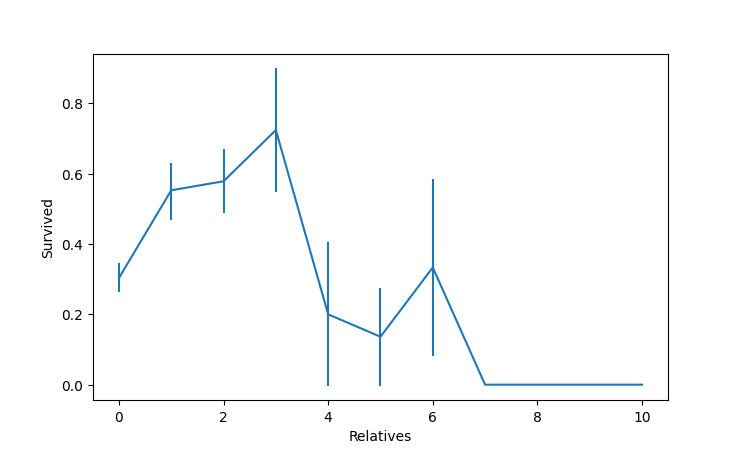
    sns.lineplot(x='Relatives', y='Survived', data=df, err_style="bars")
    plt.show()
Note that 60% of the passengers didn't have any relatives aboard, and 33% had one to three. Plotting the data relative to survivors, we get:
The chart shows that they had a high probabilty of survival with 1 to 3 relatives aboard. Passengers with no relatives aboard (60% of the population) had a worse chance of survival than those with 1 to 3, and having more than three relatives adversely affected your chance of survival.
[categorize passengers into women and their children and men (but not boys) and analyze]
We know that "women and children first" was applied to who was loaded into the life rafts first. Passenger class also influenced who was allowed to be loaded into a life raft.
Passengers who embarked in Cherbourg had the highest survival rate, likely because they were primarily first-class passengers. Many third-class passengers boarded in Queenstown, which likely contributed to the lower survival rate for passengers who embarked there.
A final look at correlation between the numerical variables:
           Survived      Deck       Age       Sex    Pclass  Relatives
Survived   1.000000  0.295812 -0.077221 -0.543351 -0.338481   0.016639
Deck       0.295812  1.000000  0.174780 -0.149405 -0.568401   0.000112
Age       -0.077221  0.174780  1.000000  0.093254 -0.369226  -0.301914
Sex       -0.543351 -0.149405  0.093254  1.000000  0.131900  -0.200988
Pclass    -0.338481 -0.568401 -0.369226  0.131900  1.000000   0.065997
Relatives  0.016639  0.000112 -0.301914 -0.200988  0.065997   1.000000
The above content has been enhanced since it was published to build more features. That revised script is available at https://github.com/markwkiehl/py_data_science_titanic. The combination of commented code snippets and visuals above helps you to see the basics of preparing data for a model.
Model Building
I have two different subroutines within the Python script, each following the process the authors Niklas Donges and Taha Bilal Uyar used to build a model. These are best exolored by downloading the Python script at https://github.com/markwkiehl/py_data_science_titanic and then following their article as you step through the script. The model following Niklas Donges procedure predicts passenger survival correctly 82.0 % of the time.
Related Links
Predicting the Survival of Titanic Passengers by Niklas Donges
Building a Machine Learning Model Step By Step With the Titanic Dataset by Taha Bilal Uyar
Python Solutions
.png)


